


Most people can probably relate to asking a child to handle a chore, only to have the kid come back way too soon, saying it's done. Or maybe you can relate to being that child. Either way, you know what comes next: checking shows the job was handled poorly, and it all goes downhill from there.
It's valuable to keep that scenario in mind when people start talking about static analysis and/or SAST performance comparisons - or really, comparisons of any kind of performance. Maybe it was fast, but what did it accomplish? That's why I want to talk today about what you ought to look at when you compare performance.
Let's say you're testing SonarQube or SonarCloud because you're considering switching tools. You already have a benchmark from the current tool because you're using it in production. Now you "just" have to test the new analyzer. Here's how to make sure you get the best comparison possible.
1. Environment
If you're trying to test the analysis speed of one tool against another, you should start with the analysis environment. Are you running both tools on the same (comparable?) machines? Do both processes have the same resources (threads, memory, etc) available? This may sound obvious, but it's easy to overlook.
2. Scope
Another speed-of-analysis factor is the analysis scope. Are both tools configured to analyze the same set of files? This one can impact both the speed and the quality of analysis. Omit important files and you won't get a thorough analysis. Include libraries and other 3rd-party content in the files-to-be-analyzed set, and you'll bog down analysis and have too much to wade through when the results come in.
Beyond files, there's also a question of operational scope. SonarQube and SonarCloud don't just raise issues during analysis. They also calculate metrics such as duplication percentage, and gather SCM data for issue attribution and identification of new code.
3. Languages
SonarQube and SonarCloud offer multi-language analysis. By default. There's no extra setup or configuration; it just happens. So with SonarCloud and SonarQube you're probably getting a broader analysis scope than with your other tools. This broader analysis can impact speed - because more files are analyzed - and obviously results as well.
So if SonarCloud / SonarQube analysis takes a little longer than a specific tool in your benchmark, you should consider how it stacks up against the full set of tools required to replicate the same breadth of results.
4. Rules
While we're talking about results, we should also talk about rules because they have a big impact too. SonarQube and SonarCloud don't just provide multi-language analysis. They provide multi-domain analysis too. So it's not just a security / SAST analysis, or just quality. SonarCloud and SonarQube find Bugs, Code Smells, Vulnerabilities, and Security Hotspots. That means more rules running at each analysis, finding more issues. Doing all that work may take a little longer - maybe not - but it provides a depth of analysis that's important for keeping a codebase clean and safe.
5. Issues
So now let's talk about results. Everything up to this point has been about speed-related performance: how to make sure speed tests are as fair as possible and what to take into account when evaluating the differences. Now let's get to the quality aspect of performance.
In a head-to-head comparison of analyzers - particularly SAST analyzers - a lot of people want to compare raw issue counts and think that tells the whole story. But that's like believing the kid who says he got his room clean in 5 minutes. You have to look a little closer to find the truth.
Let's start by assuming you're dealing with comparable rule sets. Then, when the issue counts don't match up, and you're looking at issues that are missing from one analyzer but reported by the other, the main thing to consider is: are the reports True Positives? For instance, we were asked once about a "missing" CWE-117 (Improper Output Neutralization for Logs) issue that was raised by another analyzer but not by us. Had we missed it? No, actually. Followup revealed that:
we’ve deliberately disabled raising an issue when HttpServletRequest.getHeader() is coupled with logging. The danger of “log injection” comes from the potential to introduce newline characters that can then be combined with a fake log message to trick someone into inappropriate action. Since HTTP headers can’t contain newlines, there’s no risk in this case.
We weren't reporting the issue on purpose. In fact, we've done a lot of work to squelch false positives in general, so developers don't waste time with them. We've also made a deliberate decision to segregate reporting of vulnerabilities (i.e. something is wrong; this should be fixed) from Security Hotspots (i.e. things could go wrong under certain circumstances and human review is needed). So raw issue counts are rarely likely to tell the whole story.
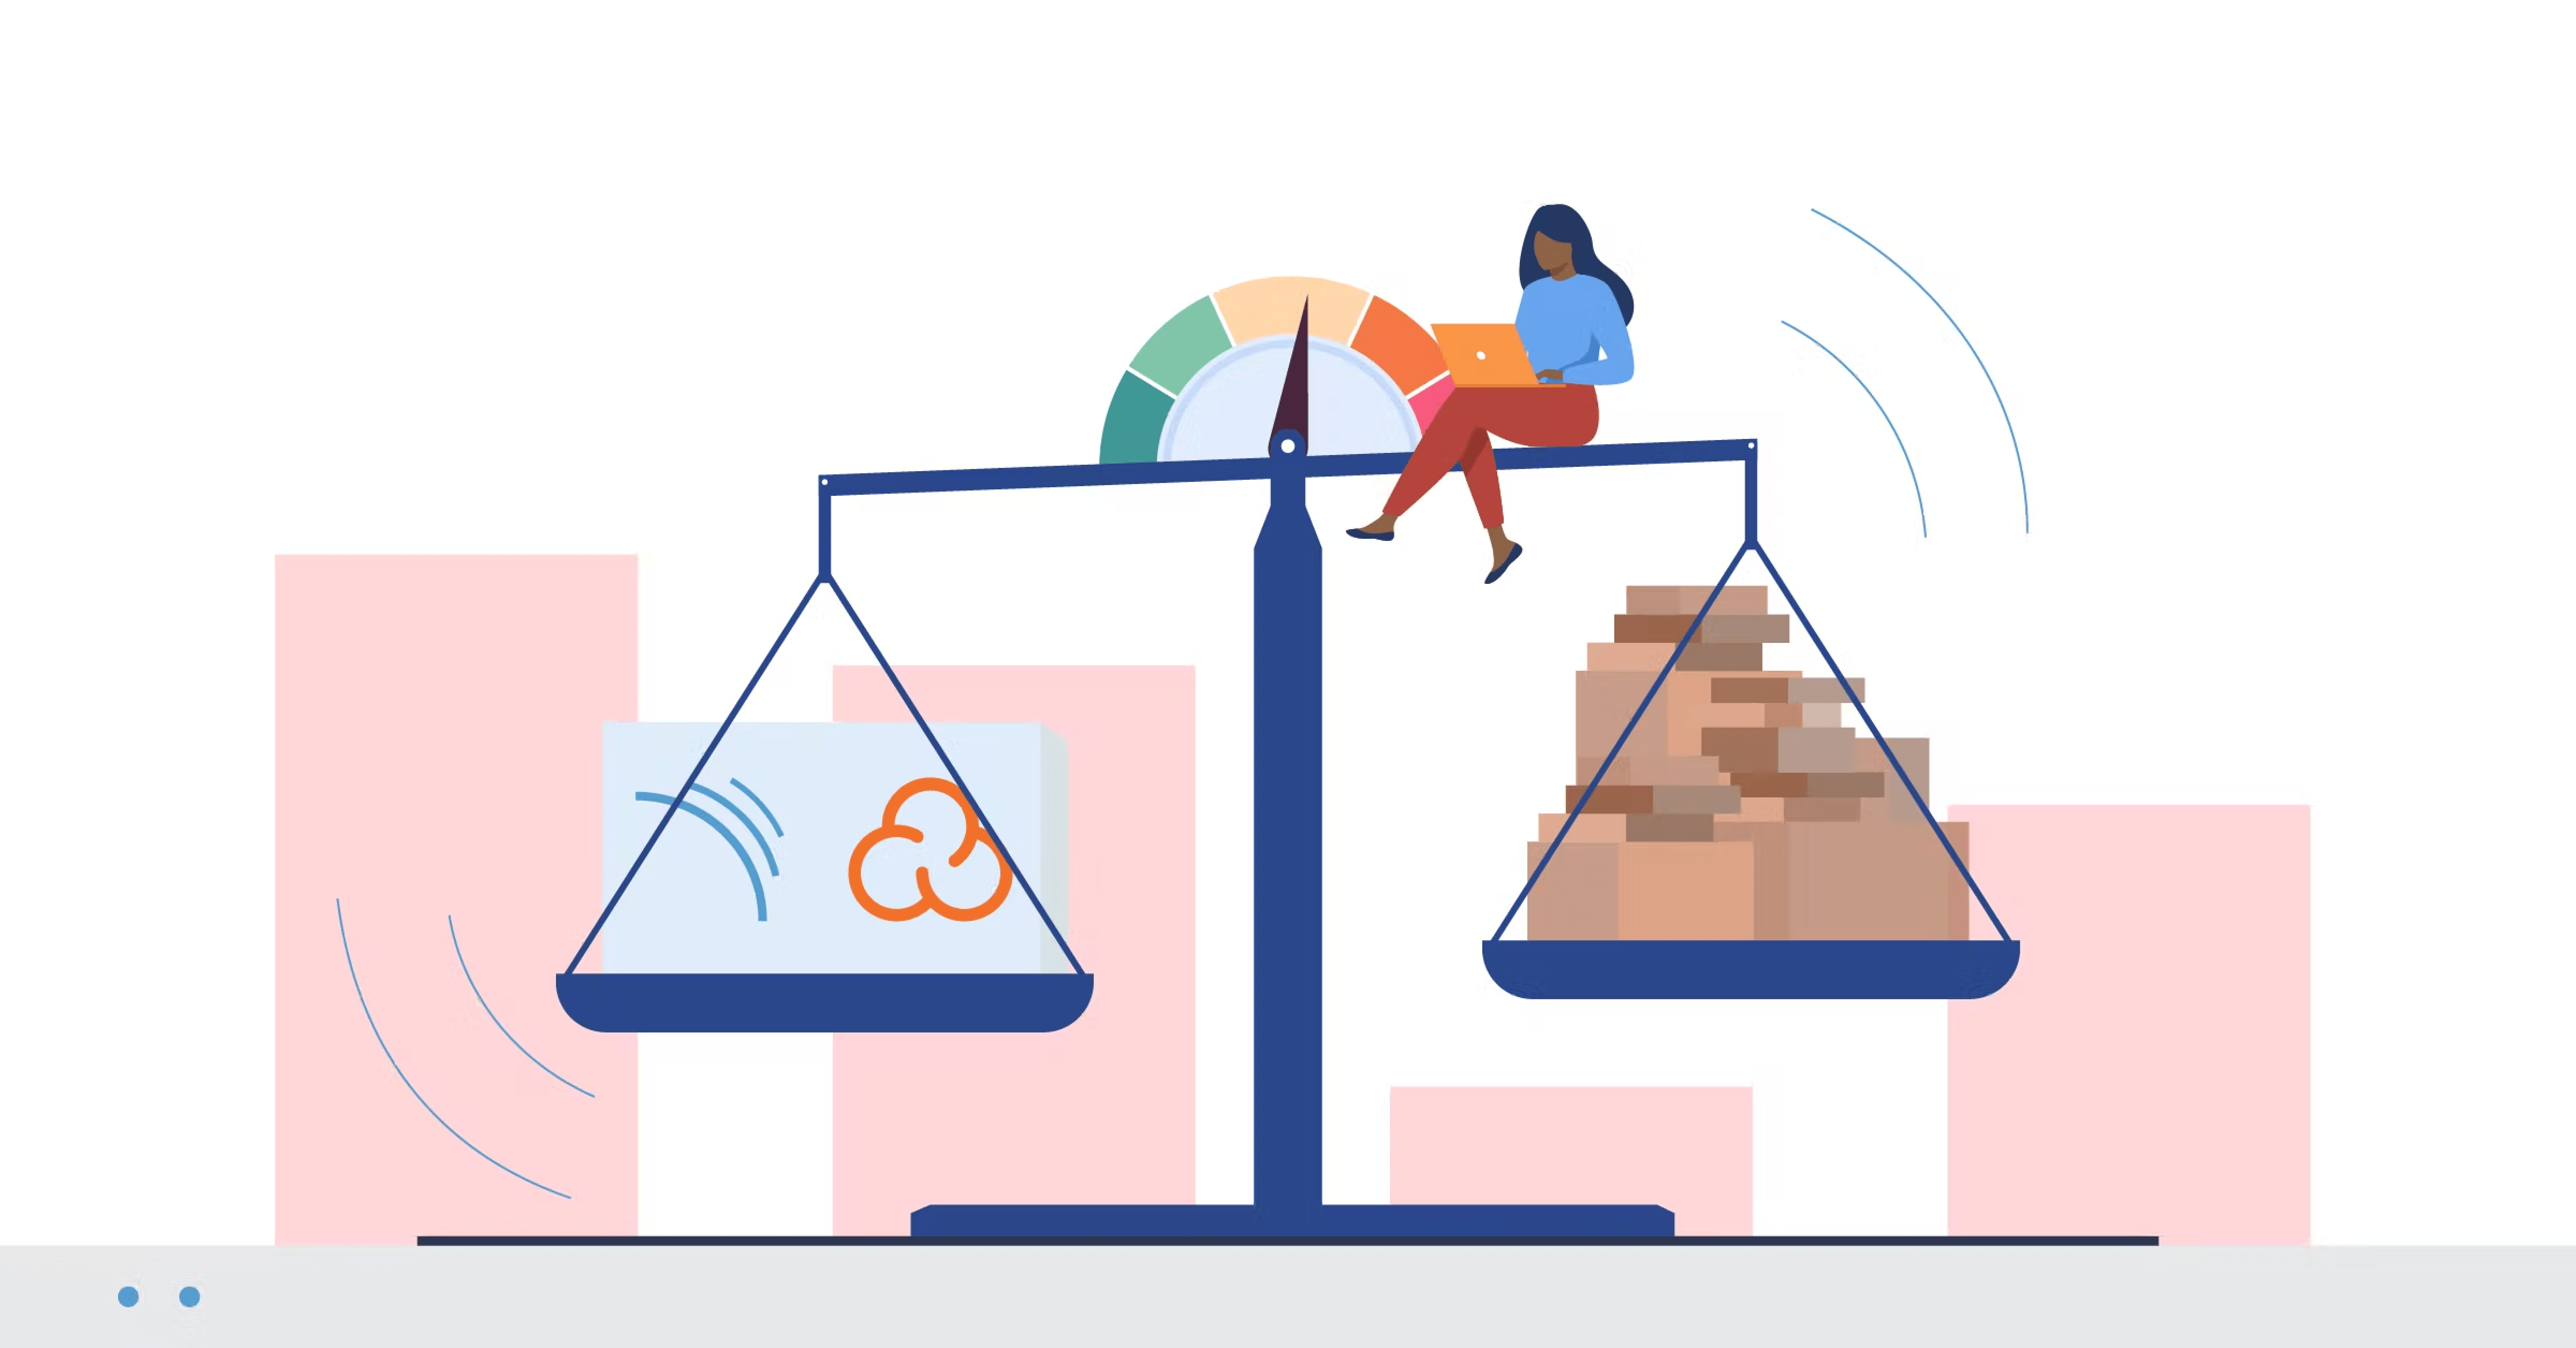
Apples to oranges
Any time you do a comparison you have to be aware of the degree to which you are or are not comparing like items in equivalent environments. There's work you can do on the front end to level the playing field and reduce what I'll call external differences - making sure analysis scope and resources are the same. And then there are the intrinsic differences that can't be "leveled".
In fact, it's nearly impossible to do an apples-to-apples comparison of SonarQube or SonarCloud with another analyzer. With our multi-language, multi-domain analysis, we're not like any other analyzer on the market. And ignoring those differences overlooks the value our analysis brings.